INTERACTION
OF METAMORPHISM AND DEFORMATION:
CRYSTAL- TO CRUSTAL-SCALE
R.A. Jamieson, C. Beaumont, and the Geodynamics
Group
Departments of Earth Sciences and Oceanography, Dalhousie University,
Halifax, Nova Scotia, Canada, B3H 3J5, beckyj@is.dal.ca
Presented on July 5, 2000 at the 15th
Australian Geological Convention
in the "Metamorphic Processes" section of the R.H. Vernon Symposium
(Section 3D2) (Sydney, Australia)
Abstract
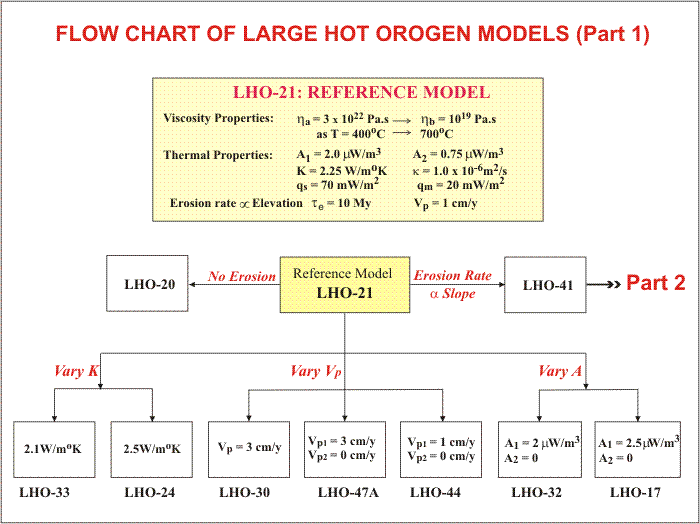
Flow Chart of Large Hot Orogen Models
Part 1
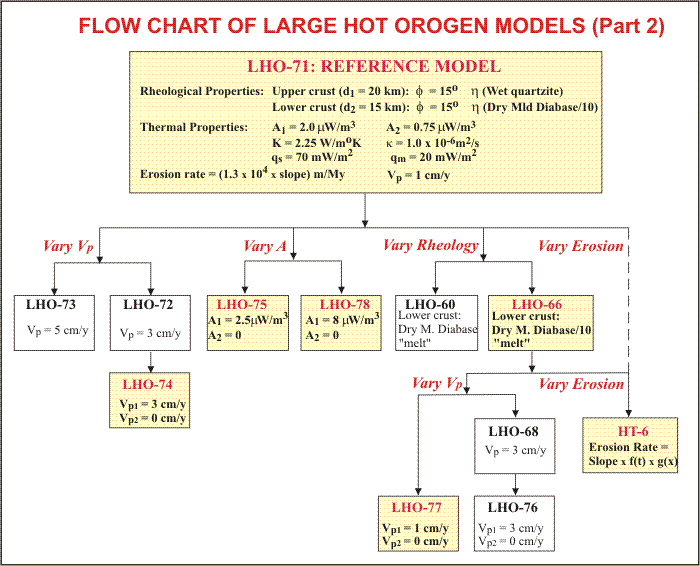
Flow Chart of Large Hot Orogen
Models Part 2
Back to Geodynamics Website
ABSTRACT
For more than thirty years Ron Vernon has influenced the ways in which
metamorphic geologists look at interactions between metamorphism and deformation.
We now understand quite a lot about how factors such as rheological and
compositional heterogeneities, fluid flow pathways, and strain gradients
influence where, when, and how metamorphic mineral assemblages and structures
form and evolve on the microscopic and outcrop scales. It is a logical
extension of Ron's work to investigate the ways in which metamorphism and
deformation influence each other on much larger scales. The controls on
these crustal-scale interactions are not easy to document by direct observation
or laboratory experiment; our approach involves numerical experiments based
on coupled thermal-mechanical computer models of convergent orogens. The
results presented here focus on interactions between metamorphism and crustal
deformation that is driven by cryptic subduction of sub-orogenic lithosphere.
On the orogenic scale, crustal deformation affects the distribution
of metamorphic rocks in a number of different ways, of which deformation
of pre-existing isograds is probably the most obvious. More fundamentally,
deformation and redistribution of tectonically accreted radioactive material
("tarm") and the rapid displacement of hot or cold rock within an orogen
control the thermal structure of the crust, and therefore the metamorphic
process itself. In turn, the evolving thermal structure of an orogen affects
tectonic style by changing the rheological properties of the crust, and
metamorphic reactions that change material properties or produce fluid
or melt will also affect the style of deformation at least locally.
The thermal structure of a model orogen reflects the competition among
rates of heat production, advection, and diffusion. This can be expressed
in terms of three dimensionless ratios - the thermal Peclet ratio (Pe =
advection/diffusion), and two Damköhler ratios (DIII
= heat production/advection; DIV = heat production/diffusion;
Pe = DIV / DIII). At high convergence
rates, where Pe >> 1, rapid transport of cool material into or beneath
a model orogen limits the effectiveness of diffusive heat transport. If
convergence rate decreases during orogenic evolution, so that diffusion
out-competes advection (Pe < 1), the orogen will heat up. Heat production,
or the rate of self-heating resulting from radioactive decay, increases
with time as a function of the concentration of heat-producing elements
and the overall volume of "tarm". Burial of "tarm" within or beneath a
model orogen can partly offset the cooling effects of subduction, erosion
of heat-producing upper crust, and heat loss from the surface (both DIII
and DIV > 1).
In our coupled thermal-mechanical models, deformation of the upper crustal
heat-producing layer produces geometrically complex distributions of "tarm"
that strongly influence the distribution of crustal isotherms. As the models
evolve, large lateral and vertical thermal gradients develop, leading to
significant lateral variations in P-T conditions and crustal strength.
For some model conditions, temperatures at mid-crustal depths exceed 800°
C, and lower crustal isotherms are inverted because cool material continues
to flow into and beneath the model orogen. However, model crustal thermal
gradients are not linked in a simple way to peak grade profiles at the
model surface, which are also controlled by the rate and mechanism of exhumation.
Crustal geothermal gradients at the time and place of metamorphism should
not be expected to correspond to metamorphic field gradients observed by
geologists at the surface millions or billions of years later.
The models calculate P-T-t paths for selected points that are tracked
throughout the evolution of the model. If we assume that the maximum temperature
(Tmax) experienced by a rock will be recorded in its mineral assemblage,
"peak grade profiles" across the model surface at selected times provide
a convenient way to compare model results with observations from real metamorphic
belts. Results will be presented from models with different initial values
of Pe, DIII, and DIV, and therefore
different model metamorphic histories, and these results will be compared
with first-order observations from natural examples.
Back to top
PART 1
GeoCanada2000 Conference
SHOWN MODEL RESULTS:
(see paper "How
does the Lower Crust get Hot?" presented at GeoCanada2000)
Reference Model LHO-21
(t = 0)
Reference Model LHO-21
(t = 60 My)
Model LHO-20
(no erosion)
Model LHO-30
(Vp = 3 cm/y)
Model LHO-47A
(Vp = 3-0 cm/y)
Model LHO-47A
(Post Convergence Extension/Contraction Gravity-Driven Flow)
Model LHO-32
(Vary Rheology)
Model LHO-41
Erosion rate proportional to Slope
|
 |
Back to top
Back to top
SUMMARY
OF MODEL SHOWN (PART 2) AND CORRESPONDING DESCRIPTION
| MODELS |
DESCRIPTION |
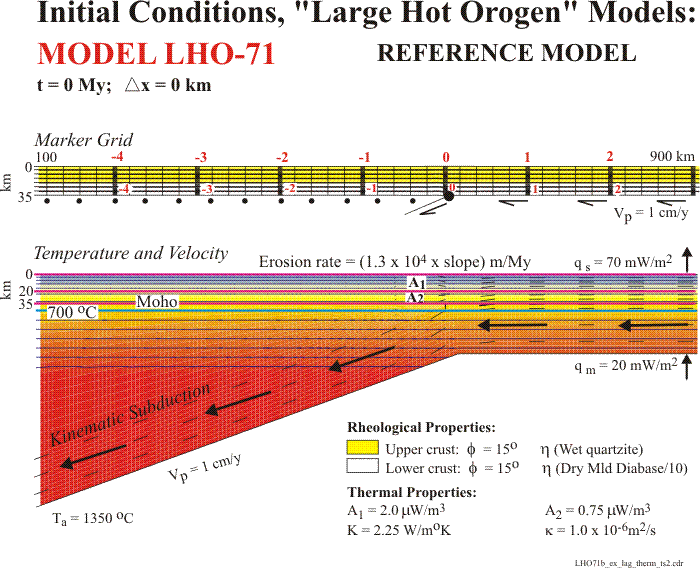
| REFERENCE MODEL LHO-71 (Fig. 1) |
Initial Conditions for Large Hot Orogen Models (t = 0 My) |
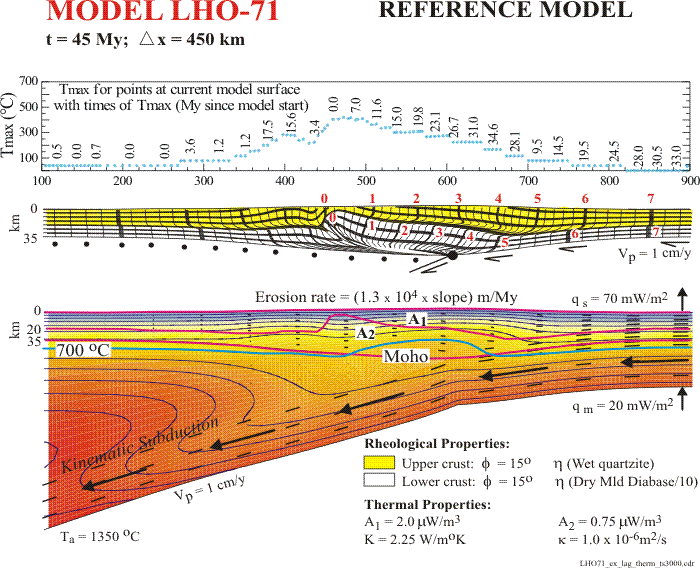
| REFERENCE MODEL LHO-71 (Fig. 2) |
t = 45 My |
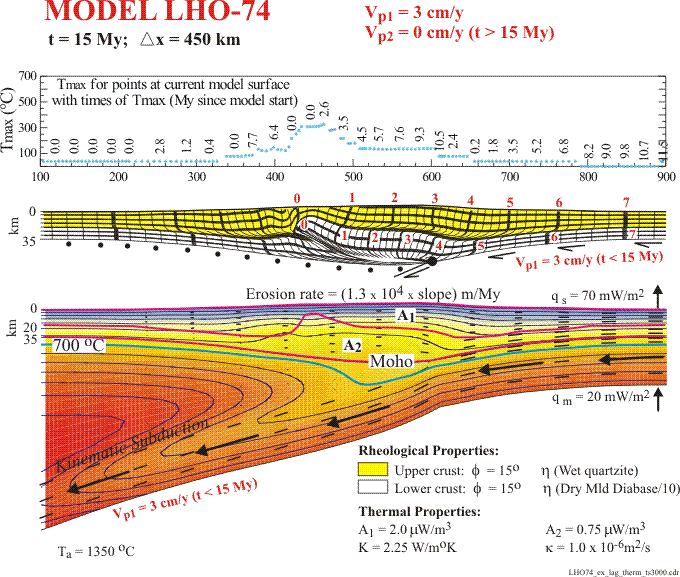
| MODEL LHO-74 (Fig. 1) |
Vary Velocity (Vp = 3-0 cm/y); t = 15 My |
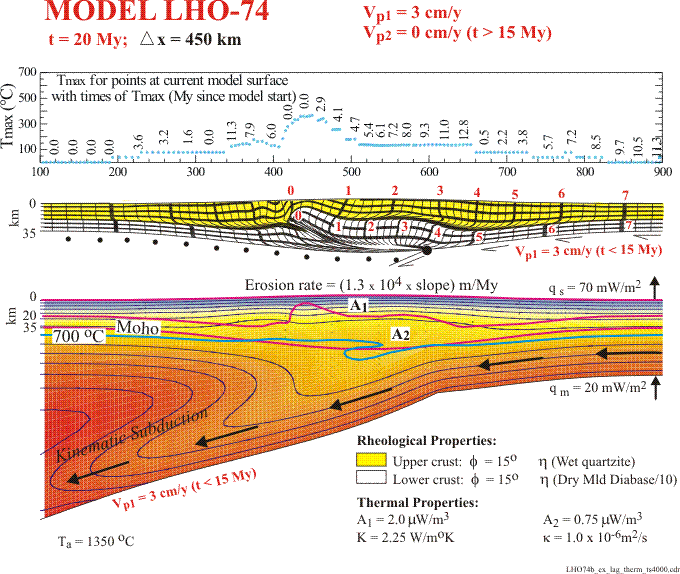
| MODEL LHO-74 (Fig. 2) |
Vary Velocity (Vp = 3-0 cm/y); t = 20 My |
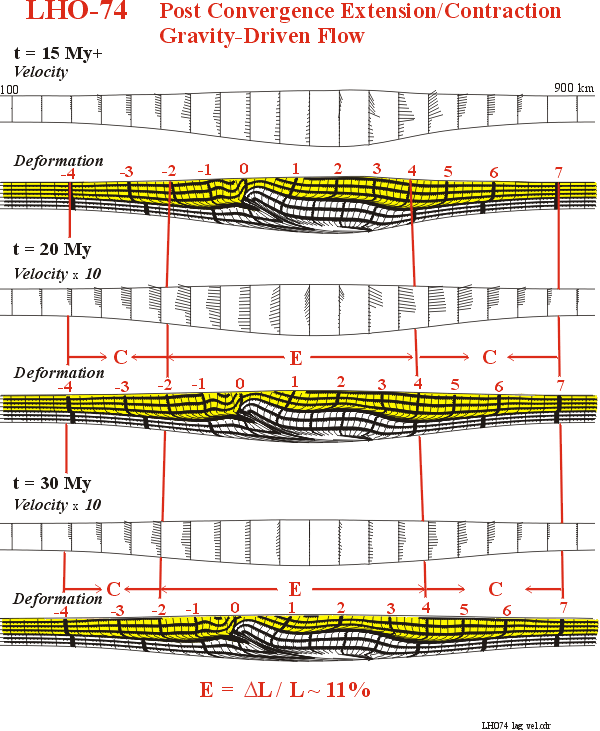
| MODEL LHO-74 (Fig. 3) |
Post Convergence Extension/Contraction Gravity-Driven Flow; t =
15 My+, t = 20 My, t = 30 My |
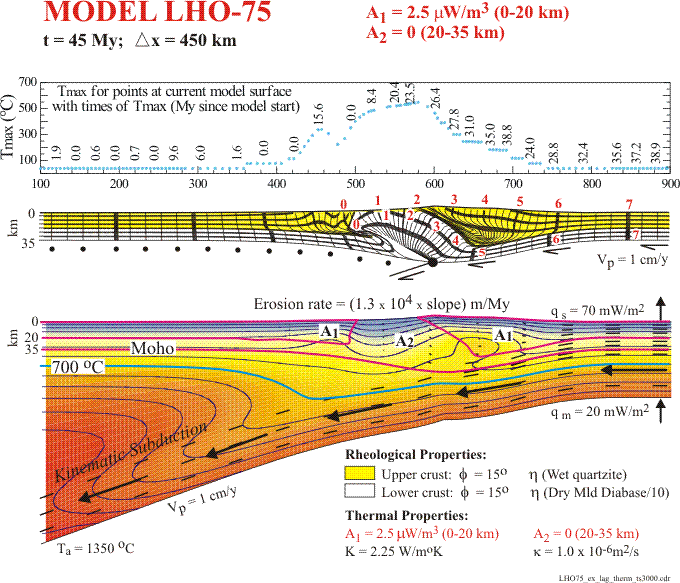
| MODEL LHO-75 |
Vary thermal properties (A); t = 45 My |
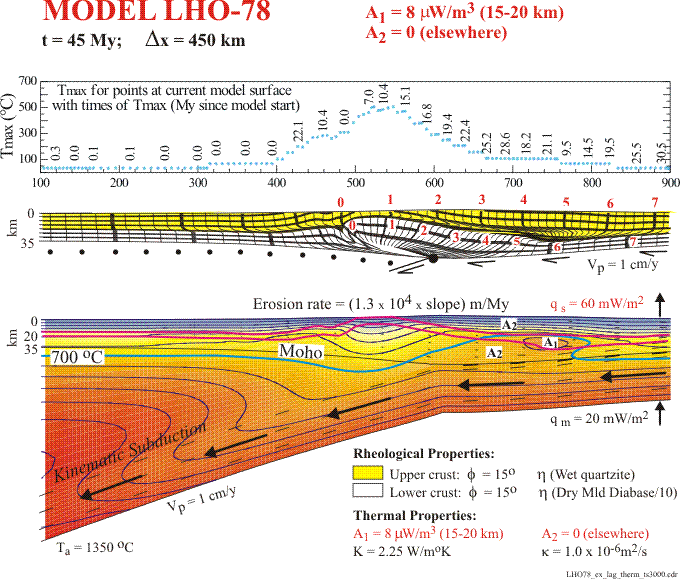
| MODEL LHO-78 |
Vary thermal properties (A, qs); t = 45 My |
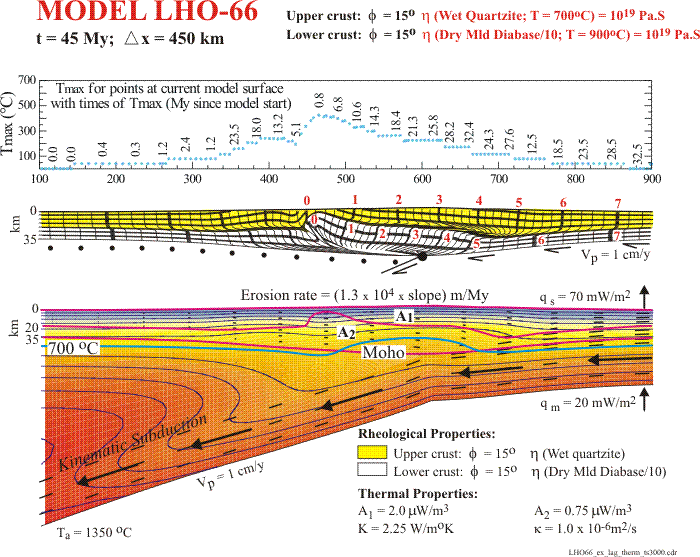
| MODEL LHO-66 (Fig. 1) |
Vary rheological properties ("melt"; lower crust is Dry Mld Diabase/10);
t = 45 My |
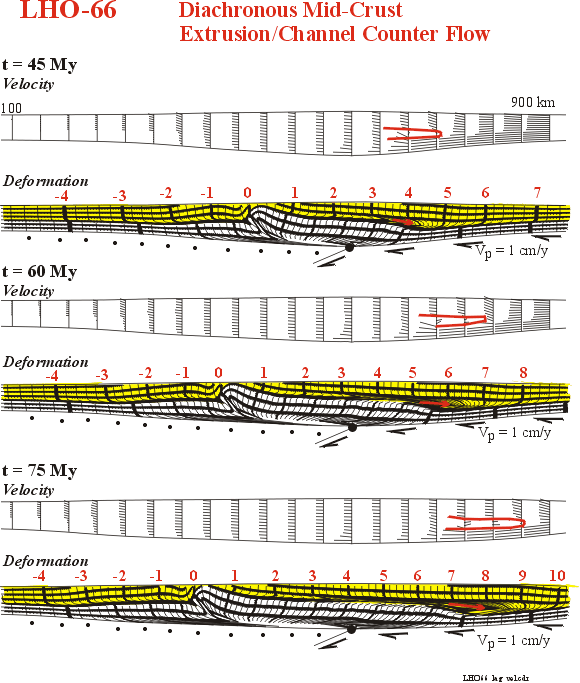
| MODEL LHO-66 (Fig.2) |
Diachronous Mid-Crust Extrusion/Channel Counter Flow; t = 45 My,
t = 60 My, t = 75 My |
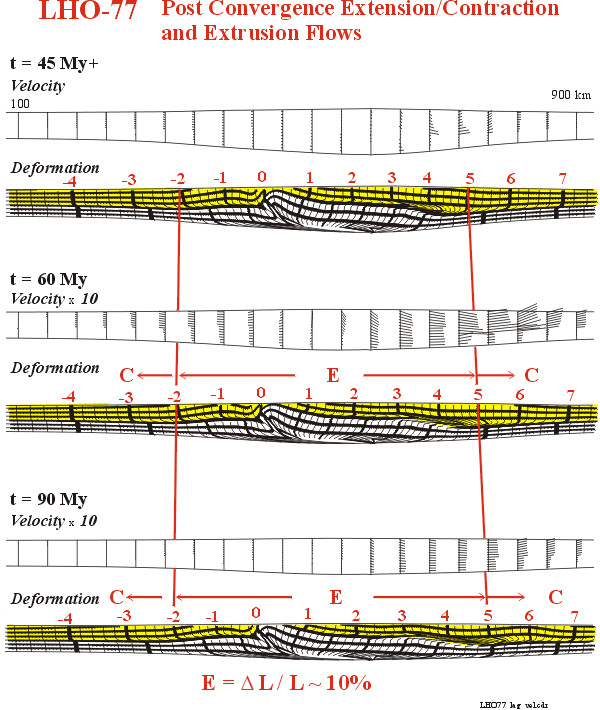
| MODEL LHO-77 |
Vary rheological properties (as LHO-66); Vary velocity (Vp = 1-0
cm/y)
Post Convergence Extension/Contraction and Extrusion Flows; t =
45 My+, t = 60 My, t = 90 My |
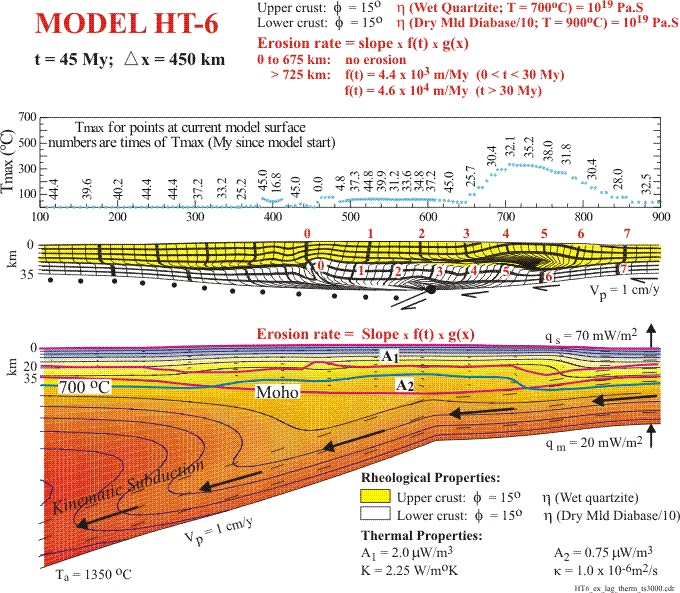
| MODEL HT-6 (Fig. 1) |
Vary rheological properties (as LHO-66); Vary Erosion: Erosion Rate
= Slope x f(t) x g(x); t = 45 My |
| MODEL HT-6 (Fig. 2) |
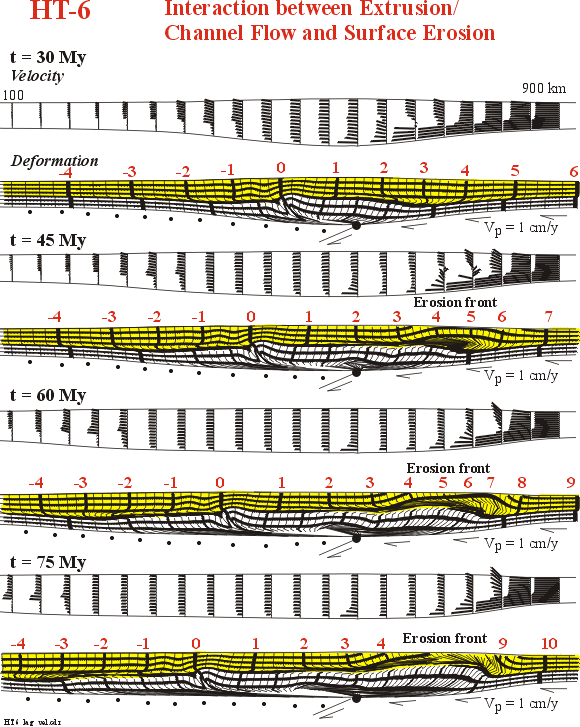
Interaction between Extrusion/Channel Flow and Surface Erosion;
t = 30 My, t = 45 My, t = 60 My, t = 75 My) |
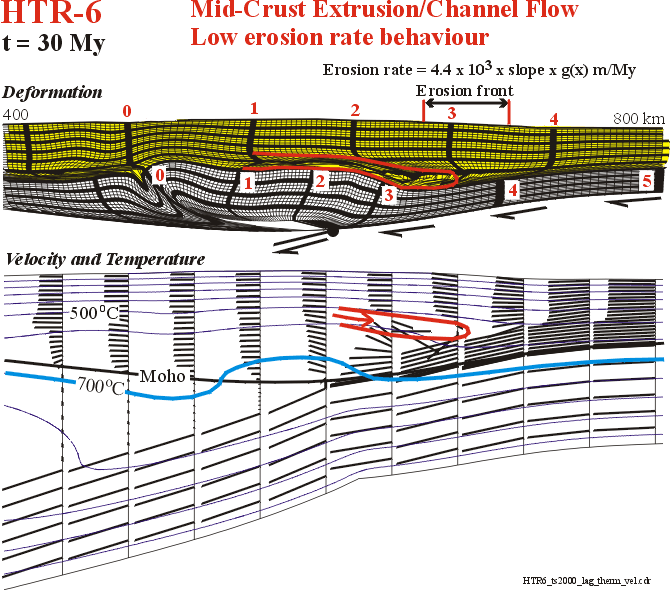
| MODEL HTR-6 (Fig. 3) |
Mid-Crust Extrusion/Channel Flow, Low erosion rate behaviour; t
= 30 My |
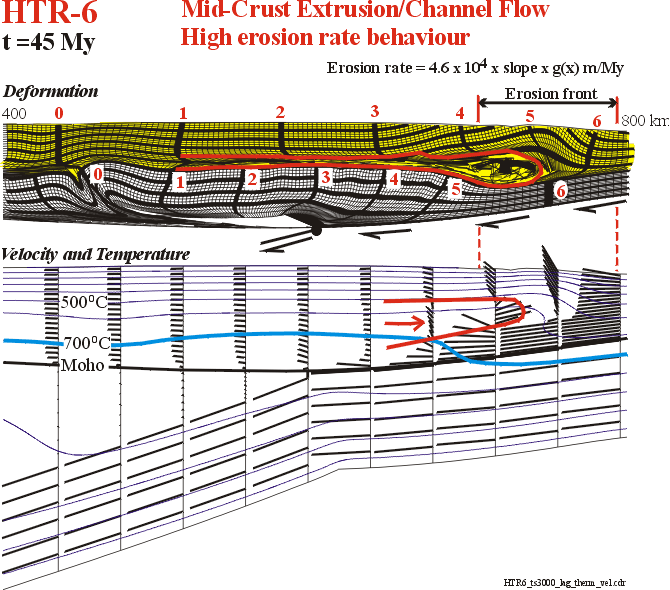
| MODEL HTR-6 (Fig. 4) |
Mid-Crust Extrusion/Channel Flow, High erosion rate behaviour; t
= 45 My |
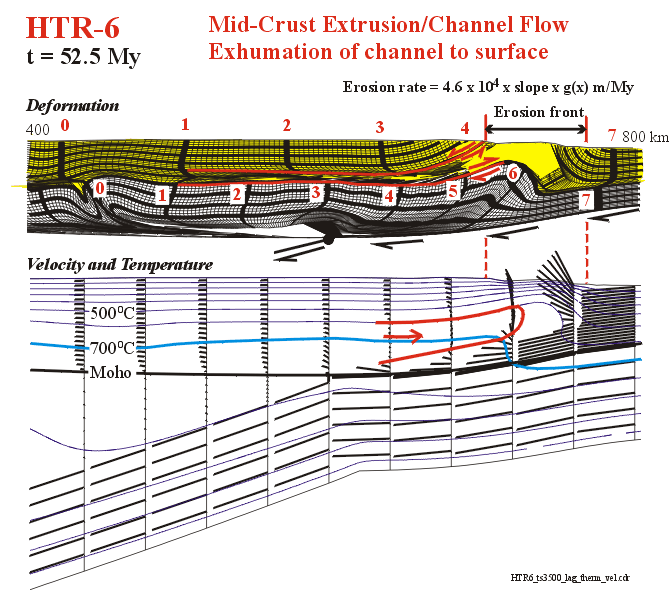
| MODEL HTR-6 (Fig. 5) |
Mid-Crust Extrusion/Channel Flow, Exhumation of channel to surface;
t = 52.5 My |
Back to Flow
Chart Part 2
Back to top
MODEL RESULTS (PART 2)

