SOPALE
Sopale Nested
Processing SOPALE Output
Printing
MOZART
TMM (Thermo-mechanical Model)
old SOPALE documentation
Geodynamics home page
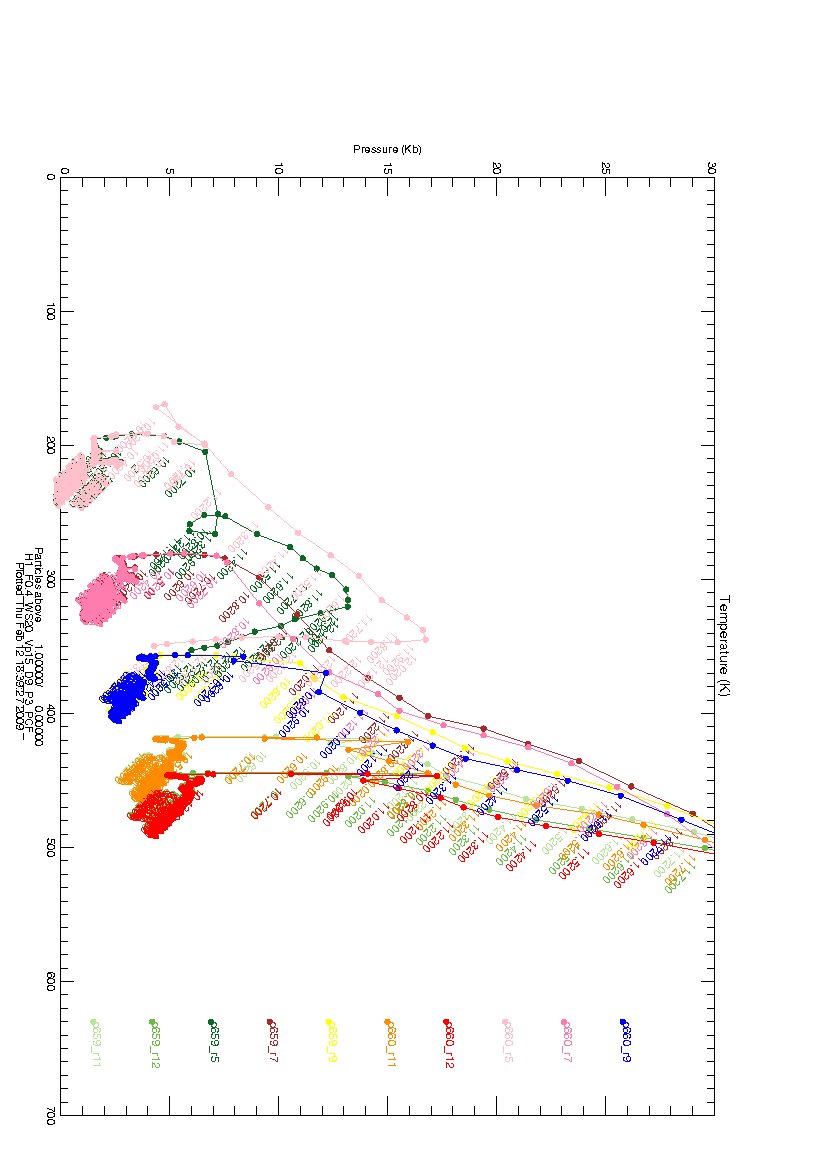
plot_ptt_path
plot_ptt_path is an IDL program which will plot the path (in
time) of a lagrangian particle on a graph of temperature vs
pressure. It reads the data in sopale's ptt_path output files. Lagrangian
particles are plotted, one colored circle for each point in time.
Documentation
The documentation that exists is in the main input file plot_ptt_path.xml. Get a copy as described below.
I/O
Input parameters are read from the file plot_ptt_path.xml. Output can be to X-Windows or a postscript file.
Running it, version 2.5
/home/dguptill/software/bmnt_library_2.5/bin/plot_ptt_path
usage: plot_ptt_path <input-file> [ <run_name> ]
  where:
    <input-file> is an input file for plot_ptt_path
      If it exists, it will be used.  No other parameters required

      If it does not exist,
        <run_name> is the sopale_nested run name.  aka nameout1.
        The name plot_ptt_path.<run_name>.xml will be substituted.
        If that exists, it will be used.
        If that does not exist, it will be created.

for example:
  plot_ptt_path x WGR13_P4_001_
Running it, earlier versions
- Optionally, make a plotting directory, and cd to it.
- Type:
cp -ip /home/dguptill/software/bmnt_library_<version>/session.pro . - Type:
cp -ip /home/dguptill/software/bmnt_library_<version>/plot_ptt_path.xml . - ...edit plot_ptt_path.xml to suit your purposes
- ...ensure that session.pro points to the appropriate release of bmnt_library
where <version> is the current version of bmnt_library
Running
idl session.pro.run plot_ptt_path
This page was last modified on Monday, 09-Sep-2013 19:01:39 ADT
Comments to geodynam at dal dot ca